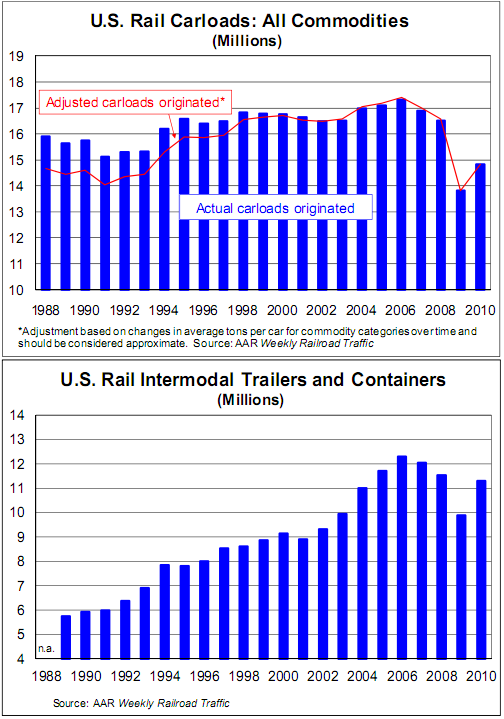
The AAR’s latest rail time indicators report showed solid growth through 2010, but still lots of room for growth on the upside:
- Way better than 2009, but still lots of room to grow. That sentiment sums up U.S. rail traffic in 2010. Total carloads for the year were 14.8 million, up 7.3% over the 13.8 million in 2009. Total intermodal volume in 2010 was 11.3 million trailers and containers, up 14.2% over 2009’s 9.9 million units. (Intermodal is not included in carload figures.)
- The 7.3% increase in carloads and 14.2% increase in intermodal volume in 2010 over 2009 might be the largest annual percentage increases in history; they’re definitely the largest since 1988, the earliest year for which we have comparable data. Unfortunately, 2010’s increases followed what were probably the biggest annual percentage declines in history in 2009, when carloads were down more than 16% and intermodal traffic was down more than 14% from 2008’s levels (see charts top of next page). In other words, U.S. railroads have recovered some lost ground, but not nearly all of it.
- Rail cars are generally higher capacity today than in years past because of such factors as the use of lighter-weight aluminum instead of steel, which allow railroads to haul more productive weight (the cargo) and less non-productive weight (the car). After adjusting for this fact, the last time (other than 2009) that U.S. rail carloads were as low as they were in 2010 was 1993 (see chart below left). If adjustments are not made, 2010’s carload total was the lowest (again, other than 2009) since prior to 1988 when our data begin. U.S. intermodal volume in 2010 was the lowest (other than 2009) since 2004 (see chart below right).
Source: AAR
Mr. Roche is the Founder and Chief Investment Officer of Discipline Funds.Discipline Funds is a low fee financial advisory firm with a focus on helping people be more disciplined with their finances.
He is also the author of Pragmatic Capitalism: What Every Investor Needs to Understand About Money and Finance, Understanding the Modern Monetary System and Understanding Modern Portfolio Construction.

