
Over the course of the last seven years many market pundits have relied on Tobin’s Q to argue that the stock market is overvalued and I’ve argued that the indicator is misleading (see here for a sampling of the many predictions made with this metric). And then today I noticed this piece on MarketWatch arguing that the stock market could fall 70% because Tobin’s Q says the market is overvalued. That’s very scary so let’s explore this some more.
First, what is Tobin’s Q? Tobin’s Q was a simple ratio created by the late, great James Tobin. It is based on some simple logic that states that a firm’s market value relative to its replacement cost of assets could give you a good idea of the “value” of that firm. It’s calculated as follows:
Tobin’s Q = Market Value of Assets / Replacement Cost of Assets
Replacement cost can be thought of as the actual cash value of assets. Market value is generally calculated as an aggregate measure. You can find Tobin’s Q on the Fred database here (it’s also in the Z.1 report under table B.103 lines 39 and 36 – the fact that I know that off the top of my head makes me want to commit suicide due to the realization that I might be significantly more pathetic than I previously estimated).
(Tobin’s Q is over 1 – you should jump out the nearest window immediately)¹
In theory, the market should price firms above their replacement cost if they utilize their assets efficiently. That is, the cost of buying the whole business should be a premium to replacement cost because the firm has high expected return on assets. So, it could be totally rational for this ratio to be over 1 and it could also be rational for this ratio to be under 1. But there are several problems with using this metric as an aggregate stock trading indicator:
- The biggest problem is that replacement cost is a lagging and inaccurate measure. Some assets just can’t be marked to market properly so their cash value is unknowable.
- The market value of financial assets is dynamic relative to the market’s perception of value. That is, what’s perceived as “value” in one market might not be “value” in another market. A P/E ratio of 10 might have been viewed as “low” in the 1950’s, but perhaps a P/E ratio of 15 is now viewed as “low”. Who the heck knows why this could happen. Relative value, like beauty, is in the eye of the beholder and not necessarily based on some historical average.
- Different economic environments will skew the metric substantially. For instance, in a high inflation environment the cost of replacement will be high relative to a low inflation environment so it’s very rational for the ratio to be higher in an era like the present one than in an era such as the 1970’s.
- Because it is an aggregate valuation metric it might not actually tell us much about the state of the financial markets. After all, we now have a fairly long history of the failed usage of macro valuation metrics like Tobin’s Q, CAPE, etc. While “value” seems to work in the micro sense, it doesn’t seem to translate well to the macro sense.
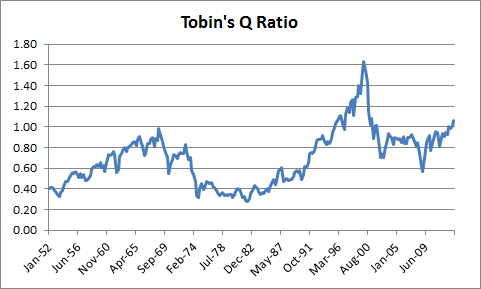
So, what is the proper level of Tobin’s Q? Well, that depends on how well we can calculate replacement costs and what premium or discount the aggregate market should sell at during given economic environments. In general, I think the tendency towards a 1.0 ratio is not irrational though it might be a stretch to argue that the aggregate should trade at a premium to replacement cost (as the ratio currently implies).
In addition, some people like to look at the above chart and simply extrapolate an average out and argue that the ratio should mean revert. Many people have even calculated this ratio back to the 1800’s where it was much lower in order to make an even more bearish argument. This is highly misleading given regime differentiation (high inflation vs low, for instance) as well as the fact that replacement costs are an approximately sound measure of market value. If anything, one could argue that the ratio has been historically too low due to market inefficiencies as opposed to presently being too high.
Perhaps the most interesting aspect of Tobin’s Q is that it’s been widely used in academic research as a takeover metric as opposed to a stock trading metric. Tobin’s Q might not help you get in and out of the stock market better, but it might actually help you identify strong restructuring targets. For instance, this 1991 research paper found that companies with low Q ratios made for excellent private equity targets.² The reason is simple – the firms were not efficiently utilizing their assets. This can be highly useful at a firm specific level, but less so in the aggregate.
Now, none of this means that the stock market isn’t currently overvalued or that stocks can’t decline. And frankly, I don’t think most investors should have this laser like focus on stocks, but rather, should focus on building balanced low fee and diversified savings portfolios. But we should all agree by now that Tobin’s Q has failed consistently as a stock market trading indicator and it probably isn’t going to help you navigate the aggregate market in the future.
¹ – The author of this article is not responsible for any defenestrations that occur as a result of reading.
² – See, “A Test of the Free Cash Flow Hypothesis: The Case of Bidder Returns“
Mr. Roche is the Founder and Chief Investment Officer of Discipline Funds.Discipline Funds is a low fee financial advisory firm with a focus on helping people be more disciplined with their finances.
He is also the author of Pragmatic Capitalism: What Every Investor Needs to Understand About Money and Finance, Understanding the Modern Monetary System and Understanding Modern Portfolio Construction.