
Here are three charts I think I am thinking about:
1. Prospects for the 60/40 portfolio don’t look so good. This is something I’ve talked about in the past, but I have to wonder – given the surging popularity of the 60/40 – are we witnessing one big example of performance chasing? Given the low interest rate environment and strong recent stock performance (leading to high-ish valuations by many metrics) the 60/40 has entered one of those phases where the future prospects just don’t look very good. This was put into graphical form by Sharpe Returns:
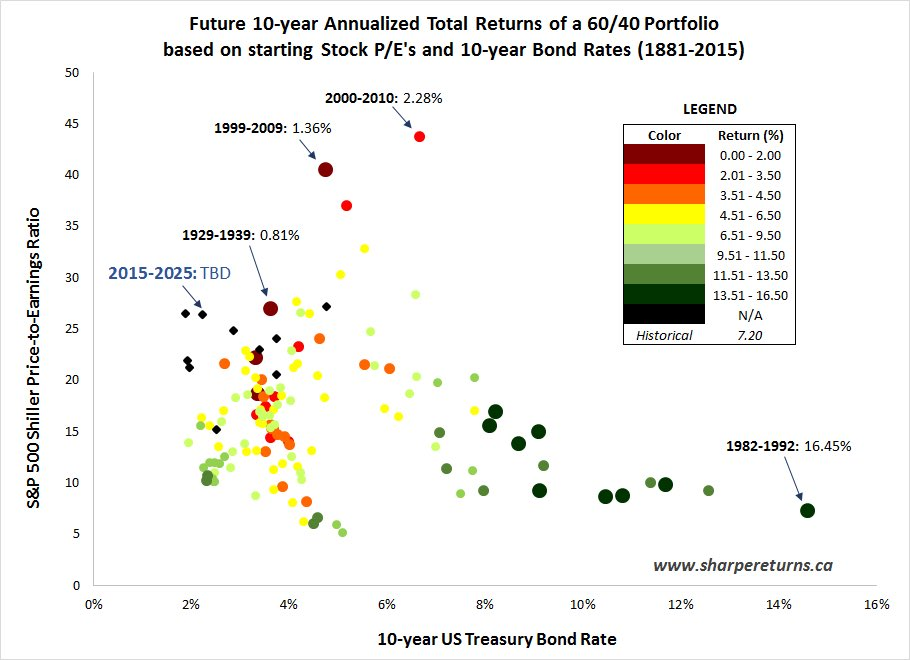
(Chart via Isaac Presley)
2015 is just an appetizer for what I think will be a very difficult 10 years for investors. The prospects for stocks and bonds just don’t look that great.
2. Has the US Dollar Already Priced in the Rate Hikes? Common sense would tell us that, in a world where the Fed is raising and the rest of the world’s central banks are easing, that the dollar will rise against all of these currencies. That’s certainly been the story so far in 2015. But this chart makes me wonder if this isn’t a huge case of “buy the rumor, sell the news”. After all, the dollar has surged heading into this rate hike. And if we look at past rate hikes the dollar tends to surge into the hike and then sell off after the hike:
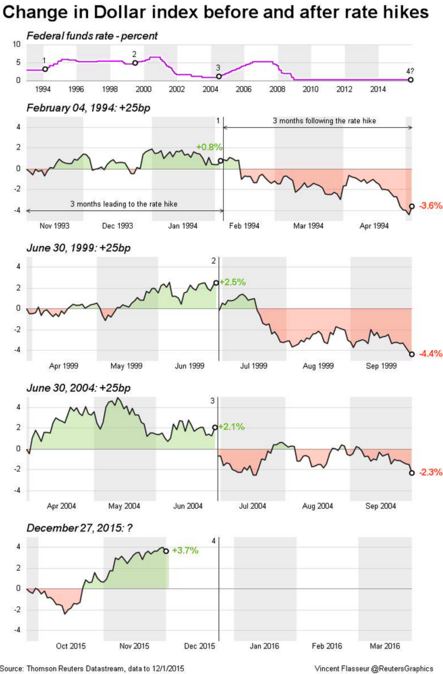
(Chart via KRS Capital)
3. Enough With the Labor Force Participation Rate Conspiracies! There has been a never ending chorus about the Labor Force Participation Rate and how the labor market is actually much weaker than the headline figures imply. Well, Goldman Sachs has put that debate to rest with some recent data. They showed that the decline in the Labor Force has been almost entirely due to natural retirement and disabled people. This data won’t stop those with an agenda from endlessly arguing that the economy is doing much worse than headline figures would have us think.
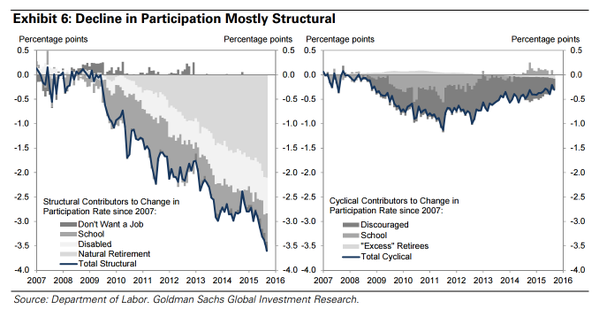
(Chart via Goldman Sachs and Floatingpath)
Mr. Roche is the Founder and Chief Investment Officer of Discipline Funds.Discipline Funds is a low fee financial advisory firm with a focus on helping people be more disciplined with their finances.
He is also the author of Pragmatic Capitalism: What Every Investor Needs to Understand About Money and Finance, Understanding the Modern Monetary System and Understanding Modern Portfolio Construction.