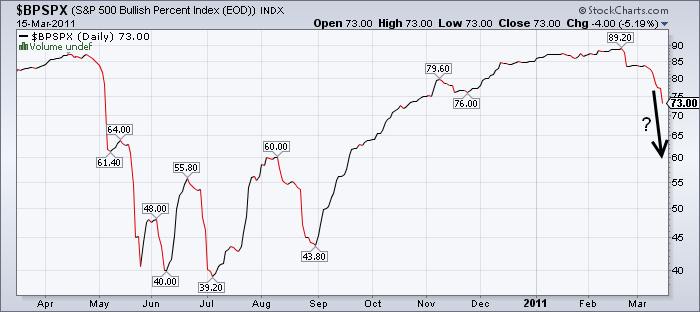
4 weeks ago I highlighted the % bullish indicator for the S&P. Reviewing the commentary might shed some light on the current downturn:
“What’s remarkable about the current reading on the S&P BPI is that it has only occurred ONCE in the last 15 years. On January 26th, 2004 the S&P Bullish Percentage Index peaked at 88.8%.
Reviewing this data shows some remarkable similarities. The market was in the early portion of a substantial bull market. After an August low the market had rallied 20%+ into the early portion of 2004. The market moved from an extreme bearish level to an extreme bullish level in this 6 month rally. What happened next? In the near-term this proved to be a headwind for the market as the S&P peaked almost to that exact day and ultimately traded 7% lower within the next 3 months. Within 6 months it traded 9% lower. It did not spell doom in the longer-term, however. After digesting this max bullishness the market traded in a range and then resumed its uptrend. 12 months following this unusual reading the market was 4% higher.”
The market is now -6% from its peak. In 2004 this proved to be a bullish longer-term sign. Is it different this time? No one can be sure, but this indicator is likely to reach levels in the coming weeks that are consistent with past bottoms. The complacency of the last few months has quickly caught up with investors. As they say, stocks take the stairs up and the elevator down. Max bullishness is likely to turn into max bearishness before we know it….Stay tuned.

Mr. Roche is the Founder and Chief Investment Officer of Discipline Funds.Discipline Funds is a low fee financial advisory firm with a focus on helping people be more disciplined with their finances.
He is also the author of Pragmatic Capitalism: What Every Investor Needs to Understand About Money and Finance, Understanding the Modern Monetary System and Understanding Modern Portfolio Construction.

Comments are closed.