
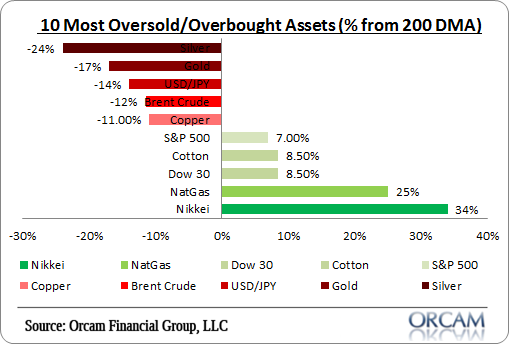
Just a little big picture perspective for you here. This is the latest view of some of the biggest global asset classes and how oversold or overbought they are. I used the percentage deviation from the 200 day moving average as a simple point of reference.
The notable stand-outs are natural gas vs brent crude and the stunning performance of the Nikkei Index versus all other equity markets. If you thought the S&P seemed overbought….
As we all know by now, the commodity complex has been slammed in recent days and precious metals have taken the worst beating. Silver is down an incredibly -24% from its 200 day moving average while gold is off -17%. The beating in Brent Crude has been nearly as bad at -12%.
Chart via Orcam Investment Research:
Mr. Roche is the Founder and Chief Investment Officer of Discipline Funds.Discipline Funds is a low fee financial advisory firm with a focus on helping people be more disciplined with their finances.
He is also the author of Pragmatic Capitalism: What Every Investor Needs to Understand About Money and Finance, Understanding the Modern Monetary System and Understanding Modern Portfolio Construction.
Comments are closed.