Unprecedented government intervention has resulted in a relative calm in markets of late. This intervention is best visualized by reviewing the sectoral balances work. As the de-leveraging process continues government transfers have effectively offset the necessary rise in savings that might have resulted in much more substantial growth declines.
But now is no time to get complacent. While it’s great that we’re beginning to see signs of sustained economic recovery this is still a patient that is on life support. As I wrote over a year ago the private sector is still in need of help. Debt levels remain extremely high and without government intervention you can almost guarantee that the private sector would be in a much deeper hole. A recent SF Fed paper succinctly described the bloated private sector debt situation, why savings rates are likely to trend higher and why the de-leveraging process is not over yet:
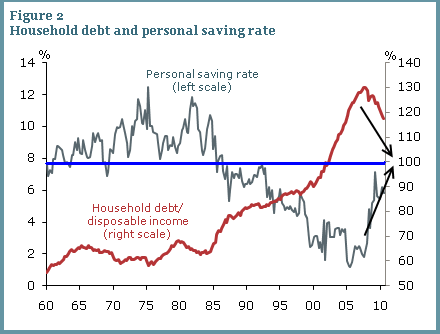
“Figure 2 shows that the household debt ratio is negatively correlated with the saving rate for most of the sample period, with the saving rate declining and the household debt ratio rising between 1975 and 2005. This pattern is consistent with the studies cited above that find a positive link between consumption behavior and credit growth. The rising debt ratio can be interpreted as reflecting changes in both credit supply and credit demand. Supply-side changes include the greater availability of credit cards and home equity loans, the growth of subprime lending, the spread of exotic mortgage products, and other changes that over time served to relax consumer borrowing constraints and thereby reduced the need for precautionary saving. Demand-side changes include the secular decline in interest rates starting in the mid-1980s that lowered the cost of borrowing for consumers. At the tail end of the sample period, beginning around 2007, we observe a declining debt ratio coinciding with a rising saving rate. This pattern reflects consumer deleveraging in the face of the tighter lending standards, excessive debt burdens, and uncertainty about future income that prevailed during and after the financial crisis (see Glick and Lansing, 2009). The main takeaway from Figure 2 is that the relationship between saving and debt is complex and likely depends on factors that govern credit availability.”

(Image edited)
“A simple empirical model of the saving rate that accounts for changes in the availability of credit to households over time can explain 90% of the variance of the saving rate and tracks the recent uptrend well. Going forward, households may keep trying to reduce excessive debt loads by increasing their saving. On the one hand, higher saving rates imply correspondingly lower rates of domestic household consumption growth so that a larger share of GDP growth would need to come from business investment, net exports, or government spending. On the other hand, an increase in domestic saving would help rebuild household nest eggs in preparation for retirement and also help correct the large imbalance that now exists in the U.S. current account.”
Source: SF Fed
Mr. Roche is the Founder and Chief Investment Officer of Discipline Funds.Discipline Funds is a low fee financial advisory firm with a focus on helping people be more disciplined with their finances.
He is also the author of Pragmatic Capitalism: What Every Investor Needs to Understand About Money and Finance, Understanding the Modern Monetary System and Understanding Modern Portfolio Construction.

Comments are closed.