

I’m getting a lot of questions these days about the low volatility we’re seeing in the stock market. So, step into my office and crack open an ice cold Bud Light. Just kidding, I don’t give people Bud Light in my office. I give them Coors Light.¹ Anyhow, a few years back I said that the VIX doesn’t really tell us much. Barry Ritholtz recently wrote a good piece on Bloomberg saying the same thing. But maybe there’s something to learn here so let’s dive a little deeper.
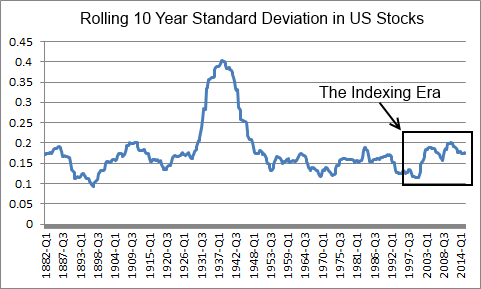
First of all, the VIX is just a gauge of the expected annual change in the S&P 500 over the next month. Second, rather than just looking at expected volatility, let’s look at actual volatility. This way we compare expectations to reality. Figure 1 shows a chart of 10 year rolling volatility going back to 1882:
A few big takeaways here:
- Actual volatility isn’t actually that low. Since 1882 the 10 year rolling standard deviation has averaged about 16. That makes sense since the stock market is generally pretty volatile. The current reading is a little above average. Now, I used a 10 year rolling figure because I wanted to capture something close to full market cycles.² Given that the stock market is functionally equivalent to a 25 year instrument its short-term data tends to be rather useless. So it’s good to use long time horizons to smooth out the short-term noise.
- Some people have asked me whether indexing is causing volatility to decline. Well, using long-term data the stock market has actually become a little bit more volatile since indexing started to pick-up. This makes sense in my opinion since my working theory on indexing is that it is coinciding with the diminishing use of hedging by active managers. That is, the more indexing there is the less active people are on average. The less active they are the less they hedge. This creates the potential for exacerbation in booms and busts. In other words, people who index will get really comfortable for long periods of time and then shit their pants when the stock market starts to falter.³ Indexers tend to be really well behaved until the moment when they wish they’d been better hedged. Then they overreact. That’s my theory at least.
- Okay, but what about the actual VIX? Current readings are very low since the VIX’s inception in 1990. But remember, this is a super short-term reading about expected future returns and actual long-term volatility isn’t that low. Additionally, the average VIX reading is 19.6 over the last 27 years so today’s reading of 10.6 is low by any measure. If you’re a reversion to the mean kind of person then you might be worried that the stock market is riskier than people expect it to be. But here’s the kicker – using the VIX is nothing more than a temporal discrepancy. Like so many things in the the investment world, people get caught up confusing what they can predict in the short-term vs reasonable long-term probabilities. There is a very high probability that the stock market will be volatile in the long-term. BUT there’s also a high probability that you won’t be able to predict the short-term periods when the stock market becomes unusually volatile. And unfortunately, using a 30 day indicator to predict the movements of what is essentially a 25+ years instrument (the stock market’s duration is at least 25 years by my calculations), makes very little sense.
¹ – Coors Light is terrible actually. I prefer PBR.
² – “Full market cycle” is an obviously loaded term. No one knows that the precise range of a full cycle is, but we can somewhat accurately calculate that the stock market is a multi decade type of instrument so this gets us somewhat close to a realistic range.
³ – Sorry for the inappropriate language here. I don’t know if people actually shit in their pants when they get scared, but it sounded appropriate here.
Mr. Roche is the Founder and Chief Investment Officer of Discipline Funds.Discipline Funds is a low fee financial advisory firm with a focus on helping people be more disciplined with their finances.
He is also the author of Pragmatic Capitalism: What Every Investor Needs to Understand About Money and Finance, Understanding the Modern Monetary System and Understanding Modern Portfolio Construction.