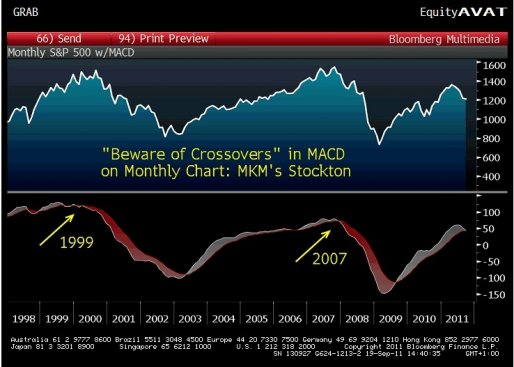
Albert Edwards has been hard at work in recent weeks studying the technical landscape and the uber bear has found what he claims is more evidence of the peak in the bull market within a secular bear market. In two separate research notes this week he described two popular long-term indicators which appear to be giving an early warning signal. The first signal is the monthly MACD which is giving just its third sell signal in the last 15 years (via Business Insider):
“The chart below shows the monthly S&P together with the MACD.
For those normal people who don’t know what the MACD is or even what it stands for, it is the Moving Average Convergence-Divergence. It is a momentum oscillator closely followed by many market participants. When the faster moving mav breaks the slower moving mav (up or down) we get a key buy or sell signal.
We may be about to break downwards on the monthly S&P chart which would give us a HUGE sell signal as was the case in Nov 2007 and the end of 1999 (also see attached note on The Killer Wave signal). If the S&P cracks we will be at 1.5% 10y US yields within a few days and probably heading to 1%. Watch this space.”
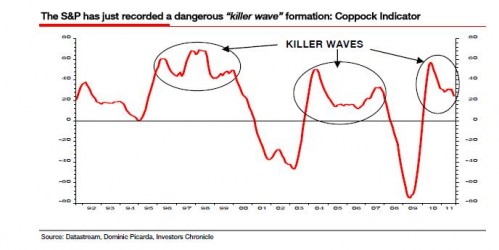
The second is the Coppock Curve or Coppock Guide. Edwards notes that this indicator is also sounding the early alarm (Via FT Alphaville):
“For those looking for a reason or a technical signal that the cyclical bull market has ended and that we are firmly back in the icy grip of the structural bear market, we would highlight the analysis of Dominic Picarda of the Investors Chronicle and the FT. He identified the S&P as having just made a killer wave. He has identified eight killer waves in the S&P 500 over the last 83 years. All have been followed by substantial losses. The average fall following a killer wave has been 40 per cent over 20 months.
As Dominic Picarda explains in his article, a killer wave is formed as follows. The Coppock indicator gives an initial sell signal (which it did last summer). However, the indicator subsequently turns up once more, without first having registered a reading of below zero. This happened in April 2011. The killer wave is then completed once a further sell-signal occurs, forming a sort of “double-top” pattern in the Coppock indicator (for Dominics article click here for a little video explaining the signal click here you might have to click more than once)”

What to make of all of this? Why are we seeing these rare technical patterns currently? I think the wave analogy by Edwards is probably appropriate. The market can be thought of as one gigantic system moving in cycles or waves. We’re all familiar with the standard business cycle and its peaks, troughs, expansions and contraction phases. Markets are no different. The interesting thing in the last 15 years is that this cycle appears to have picked up enormous volatility. The swings have become increasingly violent. I have attributed this to what I refer to as the “disequilibrium of misguided market intervention“. In our many policy fumbles over the last few decades, the Federal Reserve has helped to financialize and destabilize markets by embedding a “put” beneath them. This destructive “put” has given the market’s participants the impression that they can take outsized risk knowing that the downside is protected by a Federal Reserve that will intervene any time the markets appear fragile.
I described this process earlier this year as we saw this “put” in real-time during QE2:
“The result has been obvious – equity investors are eager to take excessive risk by buying every dip in the market with the knowledge that the market can no longer decline. It’s a lot like walking a tightrope knowing that there is a cushion just 5 feet beneath you. There is no need to be overly careful. The problem arises when too many people start jumping on the tightrope with you and create a disequilibrium in the system. At some point the rope becomes unstable and possibly snaps. Except this time your cushion isn’t a soft padding, but someone else’s head. People get hurt. You get the picture. What Bernanke has created is not all that different. It’s an environment of spoiled tightrope walkers who are conditioned to take risk and believe they will always receive their treat when they begin to cry. It might be “working” for speculators, but is it good for the US economy?
The problem for Mr. Bernanke is that he must take the pacifier out of the baby’s mouth without causing a temper tantrum. And yes, Wall Street will throw a temper tantrum when the pacifier is removed. If I had to venture a guess I’d guess that Mr. Bernanke will end QE2, continue reinvesting interest payments, thus slowly removing the pacifier. But that’s just a guess. Either way, he will tread carefully and likely remain close at hand with the pacifier at the ready just in case the baby begins to throw a temper tantrum.”
Unfortunately, this market volatility has also led to increased economic uncertainty as the price volatility influences the real economy. I believe the Fed is largely to blame for this predicament as their misguided approach is partially based on the belief that the markets are an accurate and fair indicator of the real economy. This is simply not true. The market is not the economy. And it is not the efficient pricing mechanism we have all come to believe it is.
As for killer waves and MACD rollovers – I don’t know. I tend to use technical analysis as a supplement to a sound macro fundamental outlook. Unfortunately, the fundamental picture doesn’t exactly look all bright and rosy right now. And while I tend to believe that no investor can predict the future of markets out more than about a quarter, I do think this general cautious perspective meshes with the secular outlook I’ve been using since ~2006 – as long as the balance sheet recession continues this will remain a market in which buy and hold investors will do poorly. So while I’d be wary of people calling for some sort of waterfall decline, I think it’s prudent to take note of the many fundamental and technical signals that seem to be sending one unanimous signal – buy and hold is dead – for now.
Mr. Roche is the Founder and Chief Investment Officer of Discipline Funds.Discipline Funds is a low fee financial advisory firm with a focus on helping people be more disciplined with their finances.
He is also the author of Pragmatic Capitalism: What Every Investor Needs to Understand About Money and Finance, Understanding the Modern Monetary System and Understanding Modern Portfolio Construction.


Comments are closed.