
The latest CPI report from the BLS showed another reading of very low inflation. This doesn’t come as a huge surprise to anyone who can see how weak the economy is, but it is rather surprising that we seem to be seeing increasing risk of deflation.
The year over year reading of 1.7% core inflationis well below the Fed’s target upper boundary of 2% and unlikely to impact policy moving forward. In fact, this gives the Fed some breathing room even as we begin to see unemployment readings that get increasingly close to their 6.5% target.
The Orcam Housing Adjusted Price Index continues to show higher levels of inflation than the BLS data (see figure 1). That’s more heavily weighted towards the impact of housing so it’s not surprising that the index is a bit higher given the fact that house prices are up double digits year over year. Still, it’s interesting to note that this index is very low relative to the 2003-2006 period when the housing bubble was growing. The Orcam Index isn’t at all consistent with a potential supply side problem.
It’s also interesting to note the 10 year break-evens (see figure 2). Inflation expectations are cratering. I’ve add the S&P 500 to that chart so we can see just how closely equities and inflation expectations have become. It’s interesting to note the divergence here which seems to be showing a clear divergence in QE’s actual inflationary impact and what the equity markets have come to believe from this program and its mythical levitating powers.
Charts via Orcam Investment Research:
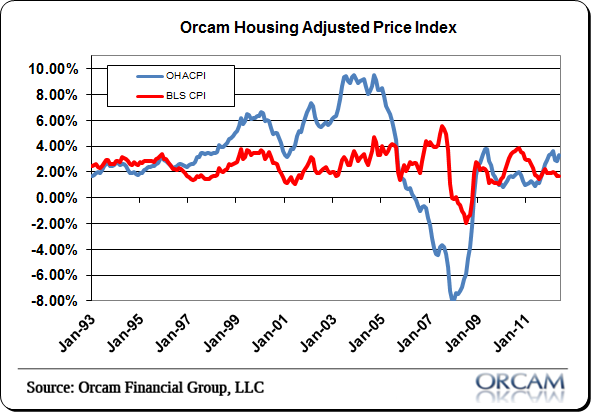
(Figure 1 – OHAPI)
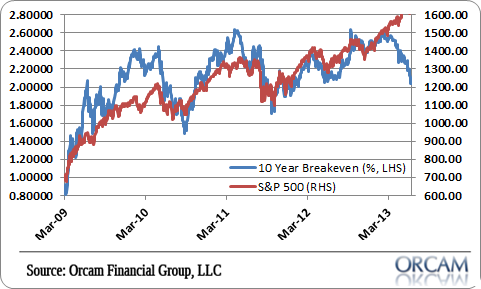
(Figure 2 – 10 Year Break-even)
Mr. Roche is the Founder and Chief Investment Officer of Discipline Funds.Discipline Funds is a low fee financial advisory firm with a focus on helping people be more disciplined with their finances.
He is also the author of Pragmatic Capitalism: What Every Investor Needs to Understand About Money and Finance, Understanding the Modern Monetary System and Understanding Modern Portfolio Construction.
Comments are closed.