
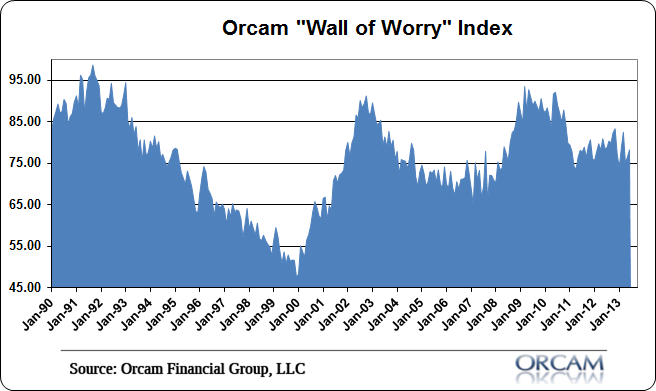
Here’s an index I haven’t updated in a while. The “wall of worry” index shows the level of fear in the market on using the inverse summation of cyclical indicators. In other words, it shows when fear is very high and when complacency has taken over. historically, the index has shown peak fear levels over 80 and has declined below 60 when complacency is high.
The latest reading of 78.2 is off the recent highs of 83 from last December when the sequester was causing all sorts of cyclical fears, but remains in a sort of “no man’s land”. I think this is indicative of an environment in which market participants are extremely uncertain about the future. This is an economy that feels like it could go either way and that leaves market participants lacking real conviction.
Chart via Orcam Research:
Mr. Roche is the Founder and Chief Investment Officer of Discipline Funds.Discipline Funds is a low fee financial advisory firm with a focus on helping people be more disciplined with their finances.
He is also the author of Pragmatic Capitalism: What Every Investor Needs to Understand About Money and Finance, Understanding the Modern Monetary System and Understanding Modern Portfolio Construction.
Comments are closed.