Nothing fancy here. Just charts showing the current recovery (or lack thereof):
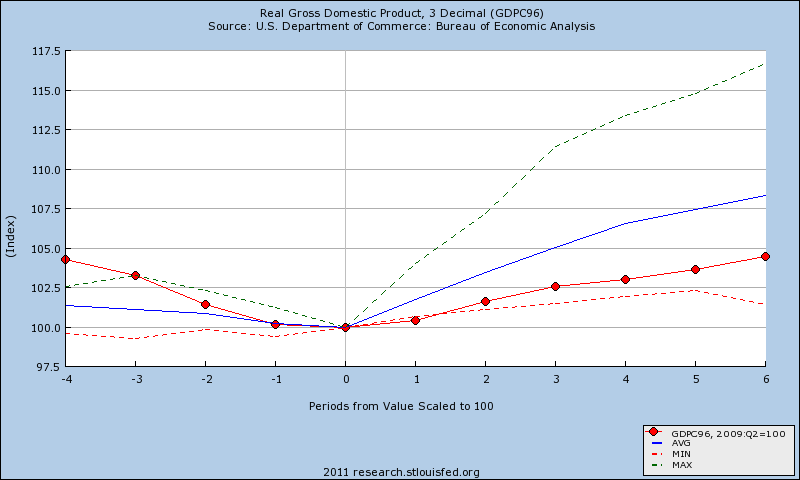
(GDP has trended close to the minimum recovery levels)
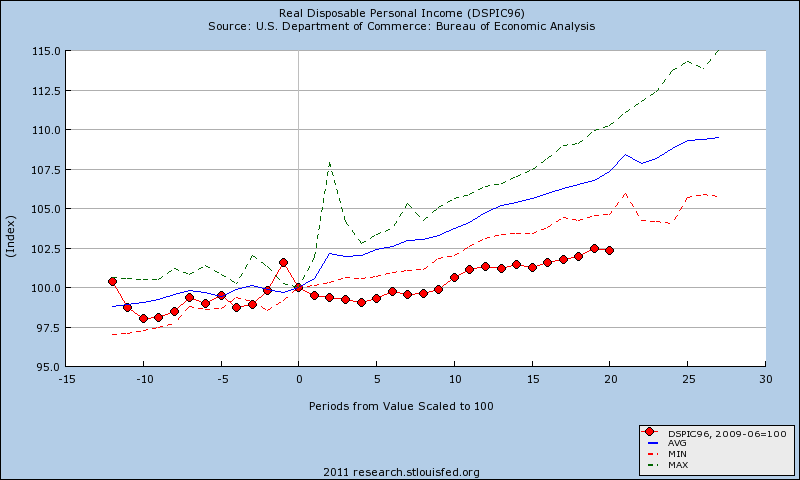
(Real disposable income is setting record lows)
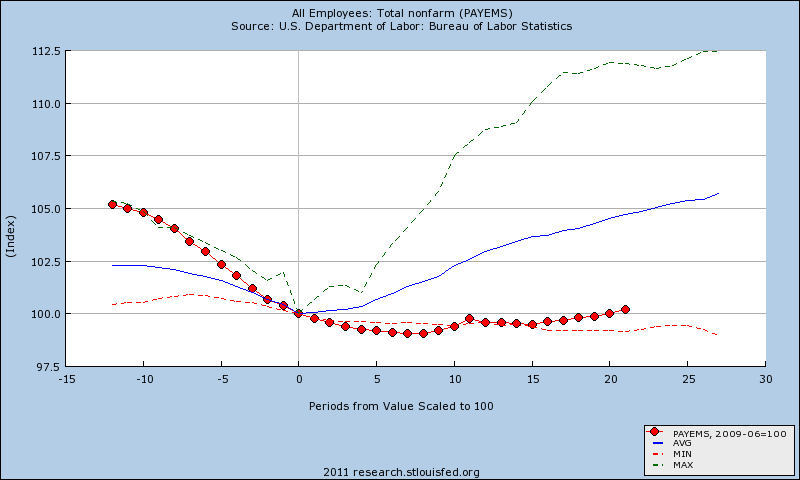
(Employment is bouncing along the bottom)
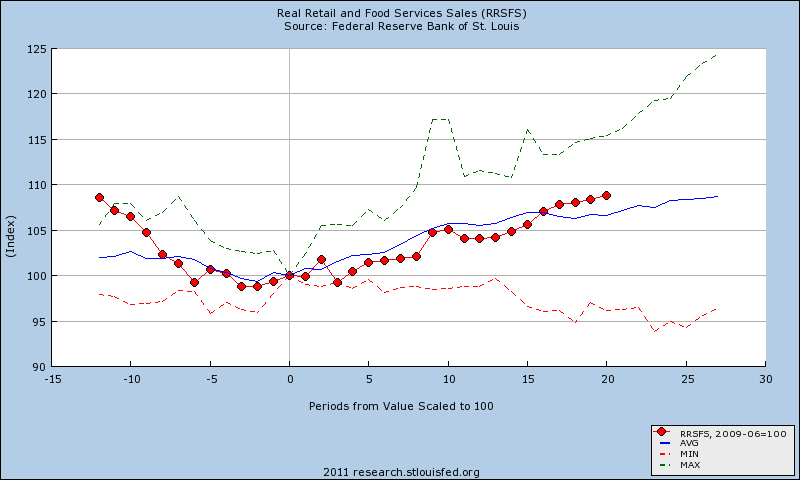
(Retail sales have managed to stay in-line with the average recovery)
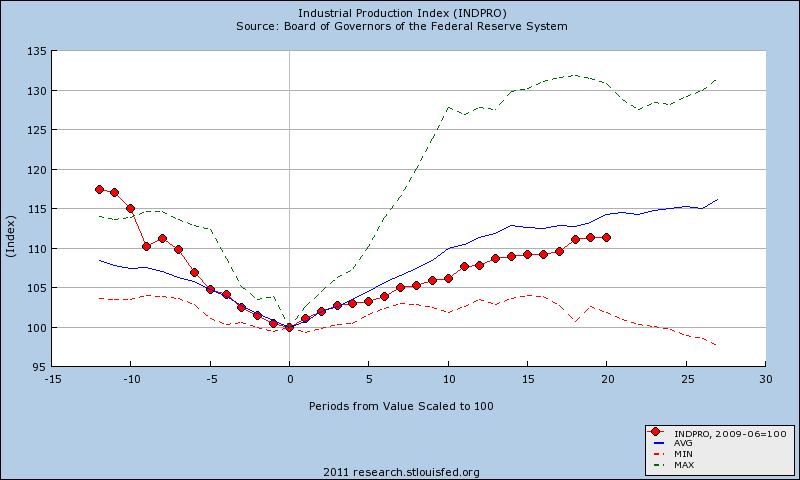
(Industrial production is trending below average)
Source: St Louis Fed
Mr. Roche is the Founder and Chief Investment Officer of Discipline Funds.Discipline Funds is a low fee financial advisory firm with a focus on helping people be more disciplined with their finances.
He is also the author of Pragmatic Capitalism: What Every Investor Needs to Understand About Money and Finance, Understanding the Modern Monetary System and Understanding Modern Portfolio Construction.

Comments are closed.