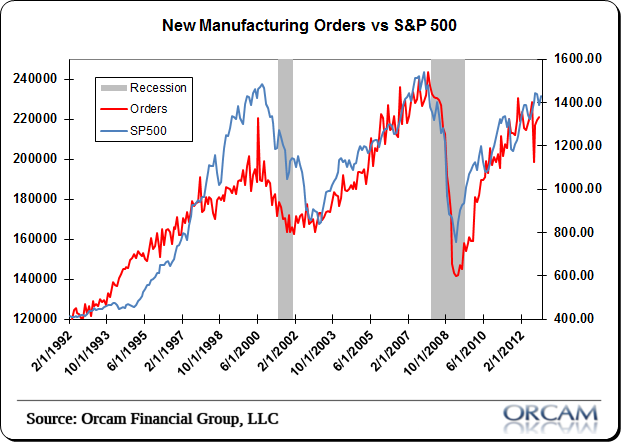
Durable goods tend to have a very strong correlation with the S&P 500. It’s far from an exact science, but tracking the directional trend in orders has tended to track the directional trend of the overall market.
This morning’s report showed another solid year over year gain of 0.7%, which was above consensus forecasts. This is on the back of last month’s gain of 1.1%. Nondefense capital goods orders were also up 2.7%. All in all, it was a good report. Here’s a bit more via Econoday:
“New orders for durables have been very volatile in recent months and net flat. But maybe there is upward momentum with the latest report. New factory orders for durables in November rose 0.7 percent in November, following a 1.1 percent gain in October. Analysts expected a 0.5 percent gain. The very volatile transportation component was down slightly on aircraft subcomponents. Excluding transportation, orders increased 1.6 percent, following a boost of 1.9 percent in October. Market expectations were for a 0.2 percent rise in orders excluding transportation. For the core measure, gains were widespread.”
Chart via Orcam Investment Research:
Mr. Roche is the Founder and Chief Investment Officer of Discipline Funds.Discipline Funds is a low fee financial advisory firm with a focus on helping people be more disciplined with their finances.
He is also the author of Pragmatic Capitalism: What Every Investor Needs to Understand About Money and Finance, Understanding the Modern Monetary System and Understanding Modern Portfolio Construction.


Comments are closed.