

In the Fortune piece I linked to excerpting Warren Buffett’s 2014 letter, he recommended a very simple approach to asset allocation – a 90/10 split between stocks and bonds in low fee index funds. As I mentioned, he also said macro views were pretty much useless. So I compared the two using the Barclay Macro Index:
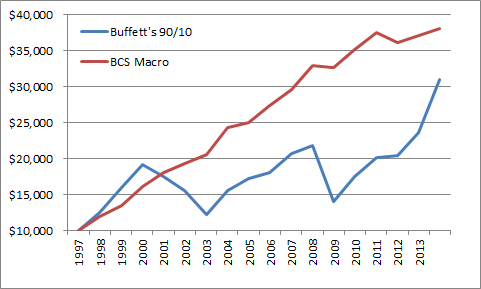
That’s pretty interesting. Obviously, past performance doesn’t mean much, but it puts things in some perspective. Specifically, it puts the concept of quantifiable risk in some perspective. Although I hate to use the idea of “risk” as “standard deviation” this picture really highlights what a 90/10 portfolio puts you through over the course of a few business cycles when we look at “risk” as variance.
A 90/10 portfolio is essentially a version of “stocks for the long run”. This is a fine type of portfolio for someone with a holding period of forever (which is virtually no one), billionaires and trust funds, but it’s a pretty imprudent way to allocate assets for most people. There’s so much that I find misleading about the concept of “stocks for the long run” that I could write a book about it…But I’ll spare you any further ranting.
Mr. Roche is the Founder and Chief Investment Officer of Discipline Funds.Discipline Funds is a low fee financial advisory firm with a focus on helping people be more disciplined with their finances.
He is also the author of Pragmatic Capitalism: What Every Investor Needs to Understand About Money and Finance, Understanding the Modern Monetary System and Understanding Modern Portfolio Construction.
Comments are closed.