
Here’s a nice alternative indicator from our friend Martin over at Macronomics. He provides us with Nomura’s air cargo indicator and some more color on the current reading:
A regular economic activity and deflationary indicator we have been tracking has been Air Cargo. It is according to Nomura a leading indicator of chemical volume growth and economic activity:
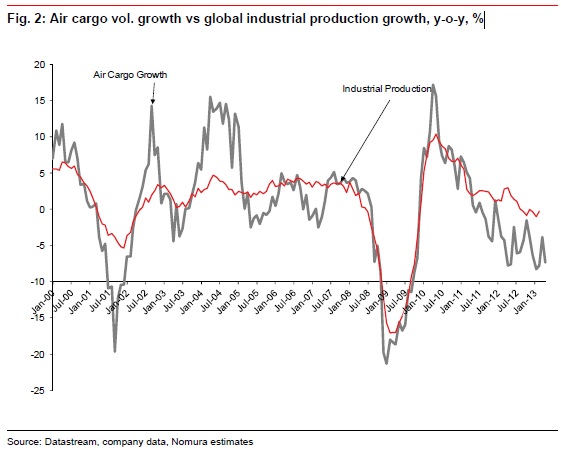
“Over the past 13 years’ monthly data, there has been an 84% correlation between air cargo volume growth and global industrial production (IP) growth, with an air cargo lead of one to two months (second graph). In turn, this has translated into a clear relationship between air cargo and chemical industry volume growth”
Our air cargo indicator of industrial activity came in at -7.4% (y-o-y) in April, following -3.8% in March and -7.8% in February. As a readily available barometer of global chemicals activity, air cargo volume growth is a useful indicator for chemicals volume growth.”
Air cargo volume growth vs global industrial production growth, y-o-y, % – source Nomura:
Mr. Roche is the Founder and Chief Investment Officer of Discipline Funds.Discipline Funds is a low fee financial advisory firm with a focus on helping people be more disciplined with their finances.
He is also the author of Pragmatic Capitalism: What Every Investor Needs to Understand About Money and Finance, Understanding the Modern Monetary System and Understanding Modern Portfolio Construction.
Comments are closed.