
I know it’s not fashionable to be bearish about anything these days, but I guess I just can’t kill the old risk manager in me. Given this predisposition, I wanted to highlight some potentially bearish indicators that have been popping up lately. I’ll highlight three such indicators:
1) The first indicator is from Thomson Reuters. It shows the S&P 500’s negative-to-positive guidance trend. According to TR the current reading for Q4 of 11.4 is at its worst level since they began recording the data. Of course, this sets the bar low for Q4 earnings, but we have to wonder how much this will filter into 2014 earnings where analysts are currently expecting double digit growth.
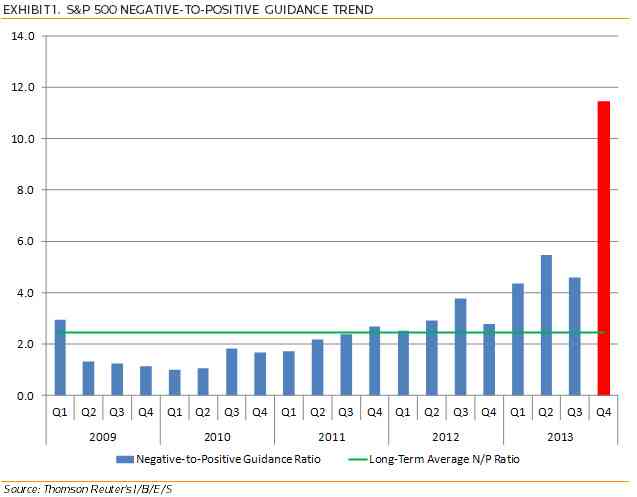
(Thomson Reuters S&P 500 Negative-to-positive Guidance Trend)
2) The second chart is the Investor’s Intelligence bull/bear difference. This is a sentiment reading that tends to reach extremes when sentiment is heavily skewed in one direction or the other. The current reading just shy of 40 has not been seen since summer of 2011 before the last significant sell-off.
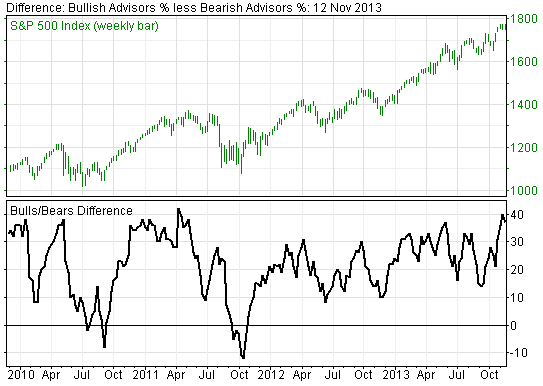
(Investor’s Intelligence Bull/Bear Spread)
3) The last indicator is a potential indication of how stretched the two above indicators have become. It shows the S&P 500’s year-to-date return broken down by actual EPS growth and multiple expansion. Of course, EPS growth is what the actual earnings growth has generated while multiple expansion represents what buyers are willing to pay for this stream of earnings. As sentiment has soared investors have become increasingly willing to pay for a reduced share of EPS growth.
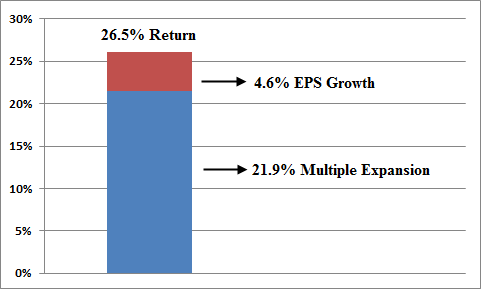
(S&P 500 Year-to-date return by EPS and multiple expansion)
Food for thought….
Mr. Roche is the Founder and Chief Investment Officer of Discipline Funds.Discipline Funds is a low fee financial advisory firm with a focus on helping people be more disciplined with their finances.
He is also the author of Pragmatic Capitalism: What Every Investor Needs to Understand About Money and Finance, Understanding the Modern Monetary System and Understanding Modern Portfolio Construction.
Comments are closed.