No, T-bonds bonds don’t remotely resemble the Nasdaq bubble….
Category: Chart Of The Day
(Just Charts)
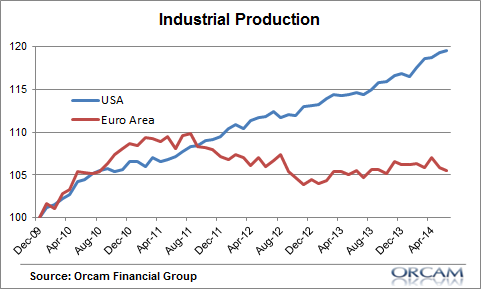
Today’s (not so) Pretty Picture: The Europe vs US Divergence
No comment necessary on this one.
AAII: Equity Allocations Hit a 2014 High in July
The AAII’s July asset allocation survey showed growing overall bullishness from retail investors as equity allocations jumped to their highest levels of 2014. The current reading of 67.5% is the second highest monthly reading since the bull market began in 2009.
The Bigger they Come the Harder they Fall
More scary charts for you….Sorry.
Rail Traffic: Still Chugging Along
If rail is an indicator of broader macro trends then this continues to point to a strong Q2 rebound in economic growth.
The Scale of Monetary Happiness
Does money really buy you happiness?
Reminder: Tapering is not Tightening
A strange thing has happened ever since the “tapering” began last December – interest rates have fallen, stocks have risen and inflation expectations have actually increased. This is almost exactly [ … ]
Chart o’ the day: Dividends and Buybacks Jump to new All-time High
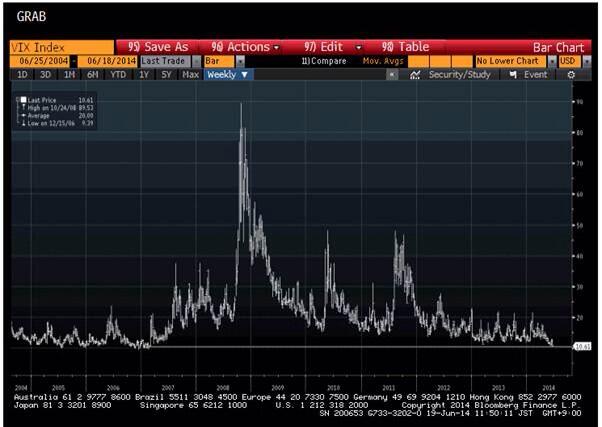
We’ve officially round tripped it now. Not only is the VIX at pre-crisis lows, but corporations are now issuing dividends and buying back shares like the crisis never happened
Chart O’ the Day: Round Trippin’ it
Not much to say here. Just a chart of the volatility index. Right back to where we were before the crisis occurred and fast approaching the all-time lows….


