Thornburg Funds has a new report out on understanding your real, real returns and it’s fantastic. I discuss this topic in detail in my book, but they do a much better job covering this than I do. So go have a read.
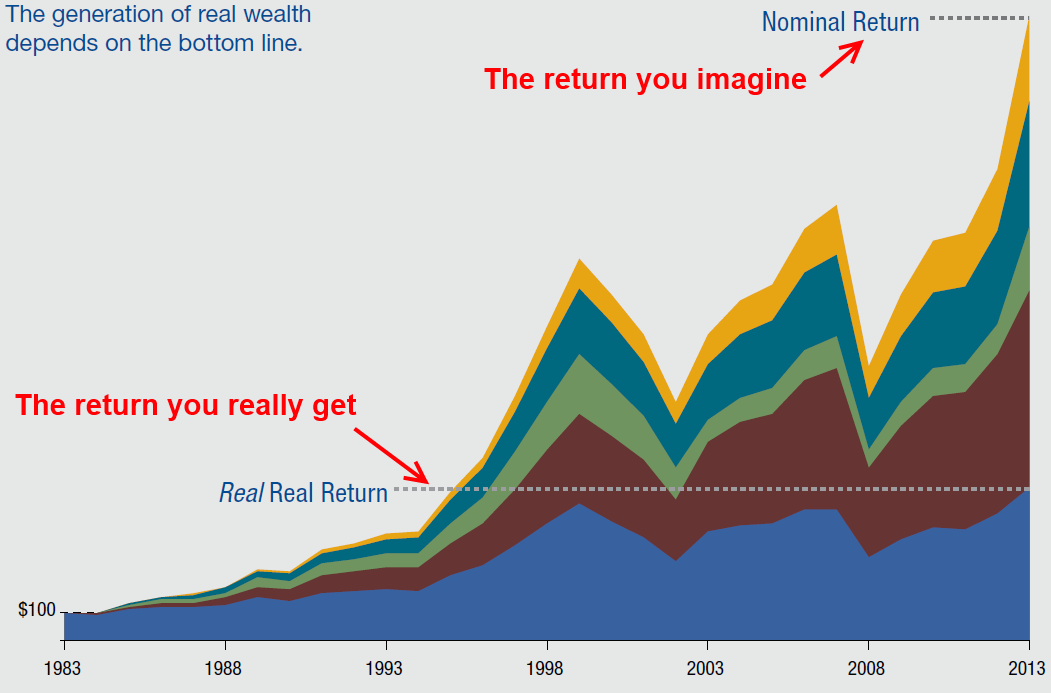
The chart below is super important. Most people who get into investing think only of their nominal returns. That’s the top line figure. But what really matters to you is the bottom line. And in the investment world that’s the real, real return you get. That’s the after tax, after inflation, after fee return. It’s the money that actually goes into your pocket relative to your purchasing power.
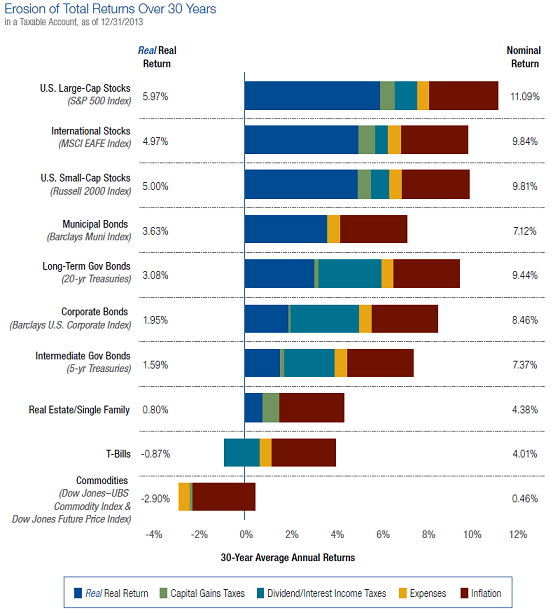
The interesting part of this discussion is that the mainstream media almost never focuses on this concept. So we’re constantly fed this myth of generating 10-12% annualized returns in the stock market or generating high returns on housing. The problem is, the stock market’s real, real return is only 5.97% over the last 30 years. And single family real estate comes in at a pathetic 0.8%. In other words, the return that actually goes into your pocket from these assets is substantially lower than most people think. And that’s because most people don’t calculate their real, real returns. They don’t properly consider adverse fee effects, adverse tax effects or the problem of purchasing power loss.
You can see the full details in the chart below. Over the last 30 years every asset class has generated a far lower return than is generally touted. Commodities are actually negative, as is cash while stocks and bonds are in the low to mid single digits:
We have to be realistic when we get involved in the process of portfolio construction and asset allocation. Setting realistic goals is one of the most important things you can do because it will benchmark the way you manage your process over time. Understanding your real, real returns is central to this.
NB – See part 2 on the importance of understanding fees.

Mr. Roche is the Founder and Chief Investment Officer of Discipline Funds.Discipline Funds is a low fee financial advisory firm with a focus on helping people be more disciplined with their finances.
He is also the author of Pragmatic Capitalism: What Every Investor Needs to Understand About Money and Finance, Understanding the Modern Monetary System and Understanding Modern Portfolio Construction.
Mark Geoffriau
Oddly enough, Dave Ramsey often mentions this (in slightly different terms) on his radio show. His explanation is that you generally have to see at least 5-6% (nominal return) in order to keep pace with inflation and taxes, and so in order to see any significant growth you should be shooting for at least 10-12% (nominal) return. Essentially the same idea.
Frederick
Negative returns on commodities. Not surprising after having been a reader of this website for 4 years.
tealeaves
We don’t really capture standard of living improvements in these returns. For example, comparing today to 30 years ago we have internet, mobile communication, advances in medicine and more affordable leisure opportunities etc. I think it is fair to say that cost of necessities like food/fuel/housing have risen but the benefits compared to 1974 are minimal to us. Yet even though phone rates and health rates have risen, cell phone and internet represent a magnitude improvement in the quality of living that “i’d argue” flippantly is not captured by these “real returns”. And in fact, could not be replicated no matter how much money you had back in 1974.
That is, I think the real returns presented here are more about covering the base costs of necessities for those that retire and need cover living expenses. But they may not be appropriate (and likely overestimate) the cost and benefits to covering discretionary leisure, and entertainment expense and the benefits that technology provide us.
If I make the average salary in the US would I prefer.
John Daschbach
Real returns over all asset classes can’t exceed real growth in the long time limit and in fact,given that the financial assets listed about are in nominal value ca. 4x a year of GDP the real return across all assets will be 1/4 of real growth if the share of return on assets and labor remains stable. What we have seen over the past few decades is a large shift in the allocation of real return to the holders of financial assets by reducing the share that goes to actual productivity (labor).
The period from ca. 1982 to 1998 caused a huge distortion in the perception of most people about what real returns are possible because of the incredible shift in returns to labor going down. Real growth is likely to be ca. 2% or less going forward for the next couple decades unless there is another crisis which drives it lower. The only way to exceed 0.5% real returns on financial assets is for the share of growth going to actual work (labor) to be negative in real terms. Will labor compensation continue decline in real terms? And for how long? If the ratio of labor compensation to real productivity stays constant (doesn’t decline) real returns on financial assets over the next two decades have to be ca. 0.5%
Steve Roth
Surprised to see small cap nominal return less than large cap. Didn’t think that was true historically. (But maybe I’m confusing with the small-cap-value advantage??)
Or: Is that largely a result of recent years’ large-cap runups? IOW, my impression is out of date?