

I posted this chart on Twitter earlier today pointing out that the last 7 recessions were all preceded by an inverted yield curve. That sparked a pretty lively discussion between lots of smart people who questioned the validity of the metric as a recession gauge in a world with ZIRP.
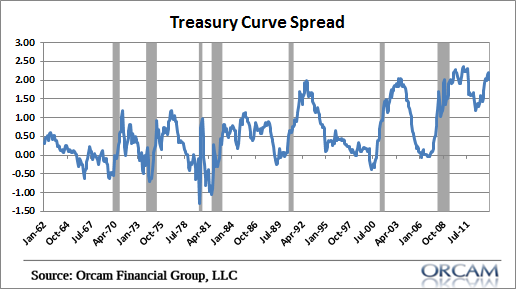
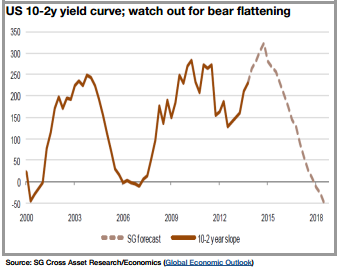
But that wasn’t really what I was thinking about when I originally brought up the chart. I was actually thinking about how the spread is historically elevated. And the reason I was thinking about this was because of this research note from SocGen citing the potential for a bear steepener in US Treasury bonds. Here’s how they connect the dots:
“With better US economic data expected in Q2, and further recovery in the eurozone, we expect a rebound in developed equities which have been lagging bonds YTD. With the US recovery and the Fed moving its median Fed Fund forecast, 10y UST could rise to close to 3% again (SGe: 3.25% by June 14). Our economists see further bear steepening of the US yield curve (the Fed’s first 25bp rate hike Fed will not materialise until mid-2015) and forecast the peak of curve steepness at the end of 2014. Higher global rates would not bode well for EM assets. We still remain cautious on EM ahead of their deleveraging cycle (for further details on EM see our special report). On the contrary, European rates should remain low and continue to converge on the back of a still-modest recovery and slow progress towards Banking Union.”
Anyhow, that’s where I was actually going with that when I posted the chart on Twitter. In case there was any confusion (which there should be because I didn’t really say much about this)….And yes, as noted by ZIRP and the state of the curve, all future recessions have been cancelled until the NBER notifies us (after the fact).
Mr. Roche is the Founder and Chief Investment Officer of Discipline Funds.Discipline Funds is a low fee financial advisory firm with a focus on helping people be more disciplined with their finances.
He is also the author of Pragmatic Capitalism: What Every Investor Needs to Understand About Money and Finance, Understanding the Modern Monetary System and Understanding Modern Portfolio Construction.
Comments are closed.