Today’s BLS reading on the CPI showed another benign price increase. Econoday has a good breakdown:
“Excluding food and energy, the CPI rose 0.1 percent, following a boost of 0.2 percent in October. The median market forecast was for a 0.2 percent rise.
By major components, energy fell a monthly 4.1 percent after dipping 0.2 percent in October. Gasoline dropped a monthly 7.4 percent in November, following a decline of 0.6 percent the prior month. Food prices increased 0.2 percent, matching the pace in October.
Within the core, softness was led by declines in prices for apparel and also used cars & trucks.
Year-on-year, overall CPI inflation came in at 1.8 percent versus 2.2 percent in October (seasonally adjusted). The core rate eased to 1.9 percent in November from 2.0 percent the prior month. On an unadjusted year-ago basis, the headline CPI was up 1.8 percent, compared to 2.2 percent in October. The core was up 1.9 percent versus 2.0 percent the month before, not seasonally adjusted.”
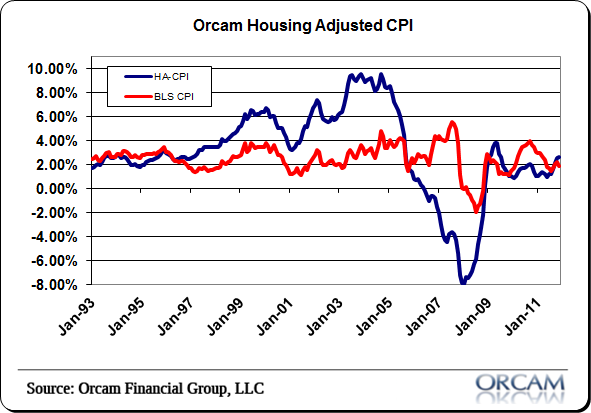
I like to look at a number of independent inflation gauges since the BLS data is by no means perfect. I created the Orcam Housing Adjusted CPI to focus on the weakness in the BLS data regarding the reporting of housing prices. Because housing is technically listed as investment and not part of consumer prices, they adjust the CPI to account for rental prices. This smooths out the CPI over the long-term, but can create a distorted near-term picture of the price changes. For instance, during the housing boom the OHA CPI showed levels of inflation that were much more alarming than the data the Fed uses. I believe such data could have helped policy officials sound the alarm on potential economic distortions sooner than they did. By focusing on the change in prices in the rental markets we were vulnerable to believing that the price changes and easy monetary policy was more appropriate than it probably was.
This months’ reading in the OCA CPI showed a 3.2% year over year increase. This was up from last month’s reading of 2.3%. Although this indicator is showing higher levels of inflation than the BLS data I would by no means characterize this as an alarming level.
Mr. Roche is the Founder and Chief Investment Officer of Discipline Funds.Discipline Funds is a low fee financial advisory firm with a focus on helping people be more disciplined with their finances.
He is also the author of Pragmatic Capitalism: What Every Investor Needs to Understand About Money and Finance, Understanding the Modern Monetary System and Understanding Modern Portfolio Construction.


Comments are closed.