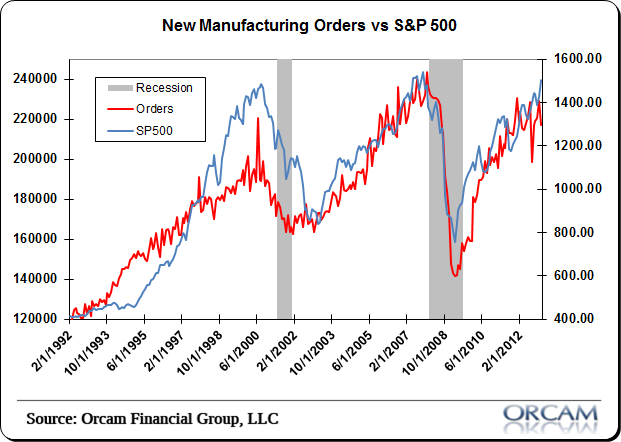
Durable goods orders were mixed this morning, but have generally been stagnant for the last 6 months or so. It’s more consistent with a slowly expanding economy as opposed to the one you might expect we have based on the S&P 500’s unstoppable rise in recent months.
I bring the S&P 500 up because durable goods tend to track the market very closely (see figure 1 below). As you can see in the following chart, the 30 year history of durable goods and the S&P 500 is very highly correlated. So, when you begin to see one diverge from the other you have to start asking yourself whether the market is pricing in an overly optimistic outcome or if the economy has yet to catch up with what the market is seeing. Of course, in a market that is highly sensitive to the jabbering of central bankers, the conclusion might be more obvious than it appears.
Econoday has more on today’s DG release:
“Durables orders are living up to their reputation as one of the U.S.’s most volatile monthly indicators. But there still were positives. New factory orders for durables in January reversed back down 5.2 percent, following a spike of 3.7 percent in December. Analysts expected a 4.0 percent monthly decline. The transportation component was the key culprit behind the drop, which plunged 19.8 percent after a 9.9 percent gain in December. Excluding transportation, durables orders increased a healthy 1.9 percent in January after a 1.0 percent rise the month before. Market expectations were for a 0.2 percent rise in orders excluding transportation.
Outside of transportation, component increases were led by machinery, up 13.5 percent; electrical equipment, up 1.4 percent; and “other,” up 1.3 percent. On the downside, weakness was led by computers & electronics, down 5.3 percent, and primary metals, down 3.6 percent.”
Chart via Orcam Investment Research:
Mr. Roche is the Founder and Chief Investment Officer of Discipline Funds.Discipline Funds is a low fee financial advisory firm with a focus on helping people be more disciplined with their finances.
He is also the author of Pragmatic Capitalism: What Every Investor Needs to Understand About Money and Finance, Understanding the Modern Monetary System and Understanding Modern Portfolio Construction.


Comments are closed.