
Here’s an excerpt from a very good piece over at VOX. The authors make an important distinction between asset price deflations and consumer price deflations. Specifically, they find an important statistical relationship between housing prices and debt deflations. This blends nicely with the views I’ve espoused over the last 5 years and the importance of understanding debt levels in the economy and debt’s connection with asset values and balance sheets:
To what extent does the weak association between deflation and growth change once we consider asset price deflations? If anything, it becomes weaker, and the evidence confirms the expected role of asset prices.
This is the case if we examine all years of increases/decreases in the CPI and asset prices in a simple multiple regression (not shown). This indicates again that a negative link between deflation and growth is only visible during the Great Depression and that, by contrast, output growth and asset price changes are significantly positively correlated over the full sample and most subsamples.2 The link is especially strong with house prices in the postwar period.
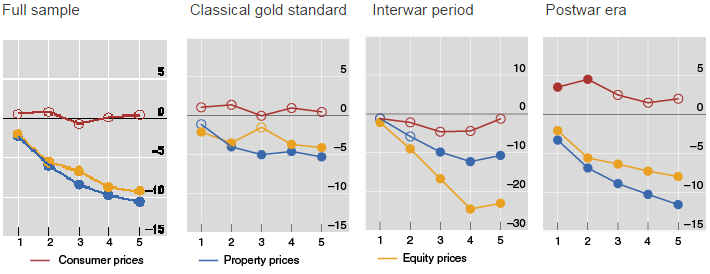
The results are actually starker if we consider persistent deflations. Here we examine the behaviour of output following peaks in the respective CPI and asset price indices (Figure 3).3 We find that the change in growth in the wake of persistent CPI deflations is uniformly statistically insignificant except for short horizons during the postwar era – where, however, deflation appears to usher in stronger output growth. By contrast, output growth always weakens in a statistically significant way following equity and property price peaks. Taken at face value, the output slowdown in the wake of both equity and property price peaks is sizeable. For example, in the full sample, the slowdown is quite similar for both sets of asset prices – cumulative growth is about 10 percentage points lower by the end of the five years.
Figure 3. Change in per capita output growth after price peaks1 (in percentage points2)
What difference does the presence of high debt make to all this? In other words, is there evidence that high debt makes deflation more damaging – Fisher’s (1993) so-called ‘debt deflation’?
This is hard to find in the data, but a damaging interaction with house prices does emerge (not shown). Specifically, we test whether the change in growth after price peaks depends on the level of public and private debt at the peak. There is little evidence that this holds for CPI peaks. By contrast, the growth slowdown appears to be considerably larger when a measure of ‘excess’ private sector debt is interacted with property price declines.
Conclusions
The evidence from our historical analysis raises questions about the prevailing view that goods and services price deflations, even if persistent, are always pernicious. It suggests that asset price deflations, and particularly house price deflations in the postwar era, have been more damaging. And it cautions against presuming that the interaction between debt and goods and services price deflation, as opposed to debt’s interaction with property price deflations, has played a significant role in past episodes of economic weakness.
Understanding banking, debt, money and balance sheets is crucial to understanding the economy and the financial markets. Anyone who says otherwise is ignoring the facts.
Mr. Roche is the Founder and Chief Investment Officer of Discipline Funds.Discipline Funds is a low fee financial advisory firm with a focus on helping people be more disciplined with their finances.
He is also the author of Pragmatic Capitalism: What Every Investor Needs to Understand About Money and Finance, Understanding the Modern Monetary System and Understanding Modern Portfolio Construction.