I’m not a particularly big fan of relying on traditional “value” metrics. It’s not just my mistrust of factor investing. It’s that I just don’t think anyone really knows what the “value” of the market is at any particular time. As I’ve stated in the past, the concept of value is dynamic so the perception of value is much like the perception of beauty. And what’s beautiful to some people in some eras might be ugly in other eras. Trying to put a figure on beauty is a rather pointless endeavor because it is not necessarily a static concept throughout time.
Today’s conflicting value signals are a perfect example of this. This figure is from the latest piece from Liz Ann Sonders at Charles Schwab. She notes the broad disparities in valuation metrics:
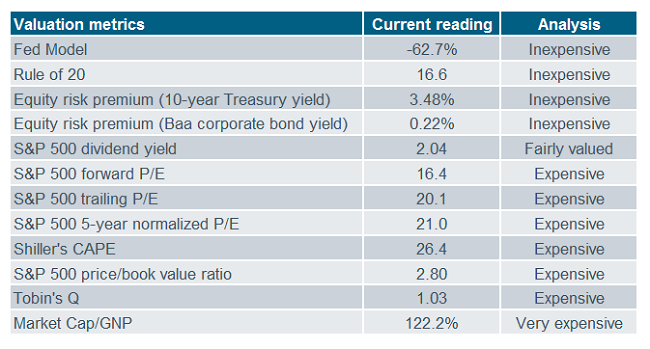
Sonders concludes:
You could probably find two market analysts on opposite ends of the spectrum from bullish to bearish; and they’d probably cite valuation as one of their reasons. It’s confusing for investors, who would probably love a simple and foolproof approach to valuing the stock market. There are myriad factors which affect valuation levels and their direction; including economic growth, inflation, Fed policy and even geopolitics.
I don’t know what to make of all of this. But all I know is that these figures have been cited by both bulls and bears for the last 7 years straight as signs of impending boom or doom. That doesn’t mean the bulls have been right. More likely, it means that you have to be careful relying on valuation metrics to guide your investment decisions.
Mr. Roche is the Founder and Chief Investment Officer of Discipline Funds.Discipline Funds is a low fee financial advisory firm with a focus on helping people be more disciplined with their finances.
He is also the author of Pragmatic Capitalism: What Every Investor Needs to Understand About Money and Finance, Understanding the Modern Monetary System and Understanding Modern Portfolio Construction.
