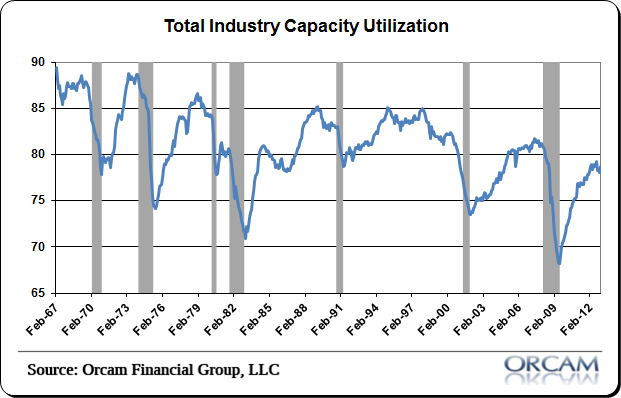
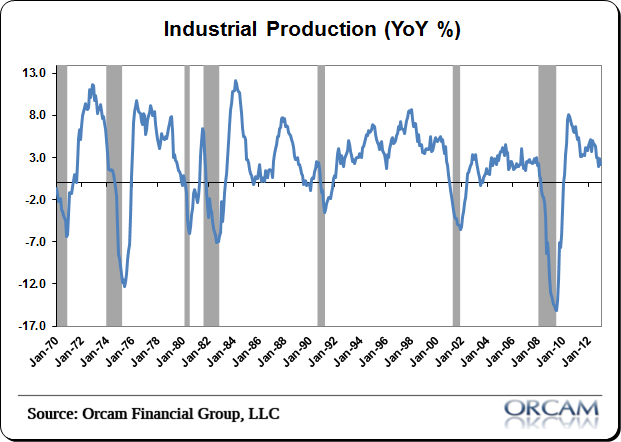
This ranks as one of the best monthly economic data points. Capacity utilization and industrial production showed some signs of life in December as total industry capacity utilization continued to move higher to a reading of 78.8. Industrial production also ticked higher, but the rate of change in both readings remains alarmingly weak. Overall, the TCU reading is an improvement off last month’s reading of 78.7 though it’s roughly flat on a year over year basis (see figure 1 below).
Here’s econoday with a bit more detail:
“Manufacturing in December was much better than suggested by the headline number for industrial production as utilities output was down sharply. Industrial production in December advanced 0.3 percent, following a 1.0 percent rebound in November (originally up 1.1 percent). Analysts projected a 0.2 percent increase for December.
In December, the manufacturing component jumped 0.8 percent, following an increase of 1.3 percent the prior month. Market expectations were for a 0.4 percent boost. Motor vehicle production was strong with a 2.6 percent rise after a 5.8 percent boost in November. But other industries were strong. Excluding motor vehicles, manufacturing output increased 0.7 percent after a 0.9 percent rebound in November.”
(Figure 1 – total capacity utilization via Orcam)
It’s not all roses though. The chart above shows a clear weakness in the economy that remains. Historically TCU has run at about 81. That’s the average. So we’re still operating well below capacity and far off cyclical highs. And the news from industrial production shows that the trend isn’t getting stronger. It’s weakening. The year over year rate of change in industrial production is at a new post-recession low of 2.2%. That’s still positive, but it’s not consistent with an economy that is booming by any means. It’s a muddle through environment….
(Figure 2 – Industrial production via Orcam)
Mr. Roche is the Founder and Chief Investment Officer of Discipline Funds.Discipline Funds is a low fee financial advisory firm with a focus on helping people be more disciplined with their finances.
He is also the author of Pragmatic Capitalism: What Every Investor Needs to Understand About Money and Finance, Understanding the Modern Monetary System and Understanding Modern Portfolio Construction.


Comments are closed.